The 2026 Global Port Index: Efficiency, Automation & Hidden Costs

Maritime Analysis by CostsAZ Logistics Team
The 2026 Global Port Index: The New Economics of Velocity
A deep dive into the arteries of global trade: Efficiency, Dwell Times, and the Hidden Costs of Congestion.
The global supply chain is no longer defined by the price of shipping a container; it is defined by the reliability of its arrival. In the post-2025 economy, “Velocity” has replaced “Volume” as the primary KPI (Key Performance Indicator) for logistics directors worldwide. The collapse of the Just-in-Time model in the early 2020s taught the market a brutal lesson: a cheap freight rate is worthless if the cargo sits in a demurrage pit for 14 days.
At CostsAZ.com, we monitor the heartbeat of global trade. We track the efficiency metrics of the World’s Top 100 Ports—from the automated behemoths of China to the strategic gateways of Europe and the Americas. This guide is a strategic manual for navigating the complex web of Port Dues, Bunker Adjustment Factors (BAF), and the “Silent Killer” of profit: Demurrage.
⚓ Global Port Logistics Engine
Calculate Freight, Port Dues, and assess Congestion Risk for the Top 50 Global Hubs.
⚓ CostsAZ Port Intelligence
Global Logistics Calculator: Freight, Dues & Efficiency.
Section 1: The Asian Hegemony (The Top 10)
To understand global logistics, one must look East. In 2026, 7 of the top 10 busiest ports in the world are located in China. The scale of operation in Asia has decoupled from the rest of the world, creating a “Super-Hub” ecosystem that dictates global freight rates.
Shanghai: The Titan
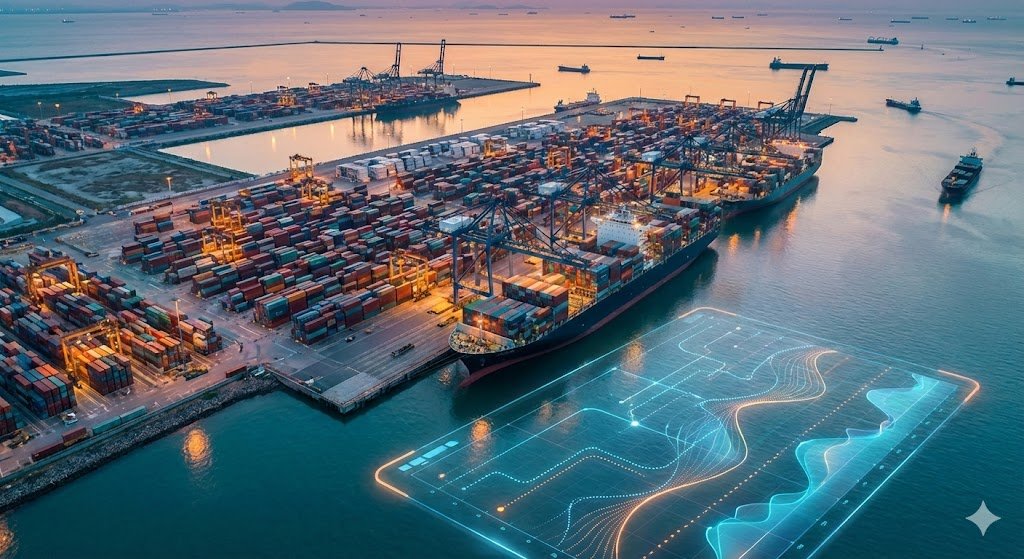
The Port of Shanghai remains the undisputed king, handling over 52 million TEUs (Twenty-foot Equivalent Units) annually. However, volume is not its only strength. Shanghai has implemented the “Yangshan Phase IV” automation project, creating the world’s largest automated container terminal. The result? A vessel turnaround time that is 30% faster than Los Angeles, despite handling 4x the volume.
Singapore: The Algorithm
Singapore operates less as a port and more as a digital platform. Their “Tuas Mega Port” initiative uses AI-driven autonomous guided vehicles (AGVs) to move containers without human intervention. For shippers, Singapore represents the lowest “Dwell Time” (the time a container sits waiting) in the industry, justifying its premium port dues.
| Port Authority | 2026 Efficiency Score | Avg. Dwell Time | Automation Level | Primary Risk |
|---|---|---|---|---|
| Port of Shanghai (CN) | 9.8 (Elite) | 1.8 Days | High | Typhoon Season |
| Port of Singapore (SG) | 9.9 (Perfect) | 1.2 Days | Ultra-High | High Cost |
| Port of Rotterdam (NL) | 9.2 (Excellent) | 3.1 Days | High | Customs Delays |
| Port of Los Angeles (US) | 7.5 (Standard) | 5.5 Days | Medium | Labor Strikes |
| Port of Santos (BR) | 8.1 (Improved) | 4.2 Days | Medium | Road Access |
Section 2: Regional Powerhouses & Choke Points
Europe: The Green Gateway
European ports like Rotterdam, Antwerp, and Hamburg have shifted their focus entirely to sustainability. The “Green Corridors” initiative means that ships running on Methanol or LNG receive priority berthing and discounted port dues (up to 15% off). If you are shipping to Europe, using a green carrier is no longer just PR; it is a cost-saving strategy.
North America: The Infrastructure Gap
The West Coast of the USA (Los Angeles / Long Beach) remains the largest choke point in the Western Hemisphere. Despite massive investment, the lack of 24/7 automation (due to union restrictions) means these ports are susceptible to “cascade congestion.” When LA sneezes, the entire Trans-Pacific route catches a cold.
Strategy: Savvy logistics managers are increasingly routing cargo through the Panama Canal to East Coast ports like Savannah or New York/NJ, which have invested heavily in dredging and rail connectivity, offering a slower but more reliable service.
Latin America: The Rise of Santos & Tanger Med
While Tanger Med (Morocco) dominates the Mediterranean transshipment market, Port of Santos (Brazil) remains the powerhouse of South America. Recent privatizations have improved efficiency scores significantly, reducing the infamous truck queues that used to paralyze the state of São Paulo.
Section 3: The Silent Killer: Demurrage & Detention (D&D)
If Ocean Freight is the cost you see, Demurrage is the cost that kills you. Demurrage is the fee charged when a full container sits inside the terminal beyond its “free days.” Detention is the fee charged when you hold the empty container too long outside the port.
In 2026, the average global Demurrage fee is $180 per container, per day. In high-congestion ports like Lagos or Manila, this can escalate to $400/day after the first week. A delay in customs clearance of just 5 days can erase the entire profit margin of a shipment.
Section 4: The Components of Shipping Cost
Understanding your invoice is half the battle. In 2026, a freight invoice is composed of several acronyms:
- BAS (Base Rate): The cost to move the box from Port A to Port B.
- BAF (Bunker Adjustment Factor): The fuel surcharge. In 2026, this fluctuates weekly based on oil and LNG prices.
- CAF (Currency Adjustment Factor): A fee to cover exchange rate volatility between the shipping line’s base currency (USD) and the local currency.
- THC (Terminal Handling Charge): The cost for the cranes to lift your box. This is paid at both Origin (OTHC) and Destination (DTHC).
- ISPS (Security): A small fee for port security protocols post-9/11.
Section 5: Technology & The Future
The future of ports is “Digital Twinning.” Ports like Rotterdam now have a complete digital replica of their physical infrastructure. They run simulations 24/7 to predict congestion before it happens. Ships arriving in 2026 are assigned a “Just-in-Time” arrival slot, allowing them to slow steam (saving fuel) rather than anchoring outside the port waiting for a berth.
Section 6: Frequently Asked Questions (FAQ)
1. What is the difference between TEU and FEU?
2. Why are freight rates to South America so high?
3. What is a “Blank Sailing”?
4. How does CostsAZ calculate the Port Efficiency Score?
Port of Shanghai Automation, Demurrage and Detention Calculator, Global Freight Rates 2026 Index, Green Shipping Corridors, Methanol Bunker Prices, Top 100 Container Ports Ranking, Logistics Efficiency Score, Trans-Pacific Freight Cost, Panama Canal Draft Restrictions, Suez Canal Transit Fees, Smart Containers IoT, Digital Twin Logistics, Customs Clearance Delays, BAF and CAF Explanation, CostsAZ Supply Chain Analysis.
© 2026 Global Port Intelligence. All Rights Reserved.
Developed & Authored by
CostsAZ SaaS Solutions